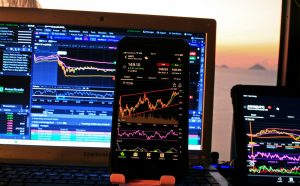
Oscillators are bar graphs that fluctuate between two points repetitively. These low and high points display oversold and overbought conditions and allow traders to leverage trendline signals to determine the ideal time to exit and enter a position.
Traders can also leverage oscillators to determine profitable positions. Momentum indicators are the most common oscillators in the foreign exchange world. Traders leverage momentum indicators to determine the trend intensity and identify the potential of a disparity. Read on to get more insights about oscillators.
Centered vs. Banded Oscillators
Centered oscillators come without lower and upper bounds. Trendline shift readings are based on a key point. These oscillators come with an unbounded structure making them unsuitable for recognizing oversold and overbought situations. Centered oscillators are appropriate for determining the existing price trend direction and momentum.
Readings over the centerline in centered oscillators are said to be bullish. On the other hand, dips that drop under the centerline are considered bearish. Centered oscillators like the moving average convergence divergence (MACD) usually come in handy to validate the prevailing trend and predict reversals.
· Banded Oscillators
Banded oscillators come with a defined lower and upper graphic range, enabling traders to determine oversold and overbought with ease. The trendline in these oscillators shifts between binary banded limits. The lower line of range-restricted indicators usually extends from zero to 20 and sometimes 30, based on the oscillator.
The upper band ranges between 70, 80 and extends to 100. Trendline shifts that hit or surpass the upper line are overbought, generating a bearish or sell signal. Trendline shifts that lie close to the lower band are said to be oversold and present bullish, also known as buy signals.
Apart from RSI, banded oscillators are usually lagging indicators. As a result, the trendline movements follow price shifts instead of preceding them. The Stochastic oscillator is an excellent example of a banded lagging indicator.
Common Forex Oscillators you Should Know About
The commonly used oscillators in foreign exchange trading are the RSI, stochastic oscillator, and MACD. All of them are momentum indicators and are outlined on independent graphs adjoining the price action graph.
· MACD
The MACD is a centered oscillator that measures the momentum, direction, and strength of a trend. To generate the histogram, calculate the difference between a (SEMA) slow exponential moving average and a FEMA (fast exponential moving average).
The MACD’s location applicable to the centerline suggests the trend direction. On the other hand, the distance directly opposite to the centerline suggests momentum. A further nine-day exponential moving average is drawn on the moving average convergence divergence to act as a signal band.
· What to Consider in a MACD
When the moving average convergence divergence drops past the signal line, a sell signal is generated. When it rises past the signal band, a buy signal is generated. Apart from trading crossovers, watch out for divergences between the price action and the MACD graph, suggesting a price reversal. Always verify a trend reversal before taking action to avoid falling for false signals.
· RSI and Stochastic Oscillator
The RSI and Stochastic oscillators are range-restricted banded oscillators. However, they utilize a variety of formulas to determine price momentum. While the RSI indicator analyzes recent losses and gains, the stochastic oscillator analyzes prevailing prices based on previous lows and highs. Further, the stochastic oscillator leverages a 3-day SMA (simple moving average) as an additional signal line to facilitate the identification of divergences.
Overall, the stochastic oscillator is specially designed for choppy or volatile markets, while the RSI performs better in trending markets. Traders can utilize both indicators to act as balances and checks in a comprehensive trading strategy.
· Factors to Consider in RSI and Stochastic Oscillator
Watch out for trendline shifts that cut across the lower and upper bands. To reduce false signal vulnerability, trade in the trend’s direction and avoid responding to trend-violating signals unless a price movement validates a trend shift. Suppose you are using the stochastic oscillator watch out for divergences, situations when price drops further or rises higher.
Such an occurrence suggests a possible reversal of the price trend. When a price shift is inevitable, you will notice a confirmation that appears as crossing signal bands and trendline shifts that move away from the prevailing oversold or overbought range and proceed to the graph’s center.
Finally
Having a strategy to help you compare and confirm price trends is critical. Adopt a trend indicator that can help you figure out a currency pair’s volatility. Verify price trends before responding to sell or buy signals that your oscillator generates. Mastering the trend strength, direction, and level of volatility helps you identify profitable signals.


