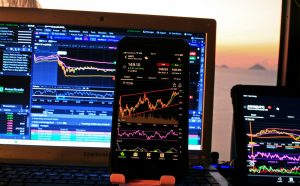
Swing trading relies on the Bollinger Bands contraction and expansion. These movements position the trader strategically ahead of any volatile action in the security to which it is applied. The Bollinger Band squeeze trading strategy is simple and exclusively utilizes the Bollinger Bands. A trader can complement this strategy by adding other validation indicators like oscillators to predict the security’s momentum.
Since the Bollinger Band Squeeze strategy falls within the breakout trading strategy, the trades taken from the signals are usually short-term. You can use it for daily or 4-hour time chart time frames. Some traders may use this strategy on higher time frames like weekly charts rather than daily, and it is up to you to determine what works best. The Bollinger Band trading strategy has no time frame limitations.
As a trader, you need to test the strategy with short time frames before applying it in the real market. The longer the time chart frame, the fewer signals that are generated by the system. This makes the daily or H4 time chart frames the best to trade in the medium-term.
How the Bollinger Bands Work
As a refresher, let’s look at how the Bollinger Bands work. The Bollinger Bands are technical indicators applied to the price charts and also referred to as volatility bands. The bands identify the rise and fall of market volatility.
When the volatility goes up, the security rises or falls sharply. When the volatility drops, the security price moves sideways. The Bollinger Bands are three lines that move around the security price. The indicator is premised on the 20-period simple moving average. The outer bands also called the upper and lower bands, are situated two standard deviations from the 20-period SMA (simple moving average)
What is a Bollinger Band Squeeze?
The Bollinger band squeeze refers to when the outer Bollinger bands contract. The name is given because the contraction causes the outer band’s width to narrow, squeezing the security price. The bands contract or squeeze as the price action range begins to drop. This happens during market consolidation, and they form a sideways range.
When the outer bands expand, they move in opposite directions, and the price rises sharply. The Bollinger Band squeeze trading strategy enters a trade before a breakout. When the price consolidation comes to an end, you can take a befitting long or short position.
The Rules of The Bollinger Band Squeeze Trading Strategy
The Bollinger Band Trading Strategy is based on some simple rules. You need to identify the consolidation areas that are determined by the band contractions of band squeeze. You can then plot some visual identifiers like horizontal lines and mark the low and high end of the occurring range within the squeeze. Once the price levels are identified, you can wait for the breakout.
The breakout can go in either direction, so you need to be sure of the breakout direction. You also need to remember that the price action can sometimes give a fake breakout. A bogus breakout dupes you into breaking out in a particular direction, only to backtrack and move towards the opposite direction. Whether or not you use the Bollinger Bands, it is almost impossible to predict a fake or bogus breakout.
· Long Position
When the Bollinger Bands contract near the lower end of the price, that’s when the setup occurs. As the bands contract, the price action turns sideways, moving in a range. This is usually the first cue for you to get your setup ready. After identifying the high and low during the squeeze, wait for the bands’ expansion and breakout. Once you confirm the breakout, you can take the long position at the beginning of the new session after the breakout.
Sometimes after a breakout and to get some support, the price may retest the breakout level. It is a brilliant idea to hold out for the retests; they rarely happen, and waiting for signals like these may cause you to miss out on profitable trades using the Bollinger bands trade strategy.
· Short Position
When you identify the Bollinger band squeeze area, plot the low and the high range levels. When and if the breakout happens to the downside, you can take a short position at the open of the adjacent candlestick. The Bollinger band squeeze strategy needs you to manage your trades actively.
One way to validate the breakout direction is to consider the slope of the emerging bands post-breakout. If you note that the outer and middle bands are still sloping upward, the breakout will go on to the upside even with the expansion. Similarly, if you note that the bands slope downward post-breakout, you can validate the short position.
The Bollinger band squeeze indicator can identify when there is an expansion or a squeeze in the bands. The indicator cum oscillator prints in the chart’s sub-window.
Conclusion
The Bollinger Bands indicator is the easiest-to-use of all the technical trade indicators. Being a two-in-one, it shows you the trend and the price consolidation and breakout periods. In summary, the Bollinger band squeeze is just a breakout trading strategy.


