Forex trading is a great way to take control of your money and make profits.
Beginners’ forex trading courses are available online, allowing you to learn the ropes at your own pace. Courses can be purchased or subscribed to for free. By completing courses, traders unlock new levels that test their skills. This approach allows you to build experience step-by-step.
Training should include how forex markets function, currency pairs and which brokers are best suited to beginners (brokers will likely offer incentives for allowing them to act as your broker like zero commissions). Learning these basics will allow you to race ahead of other beginner traders who skip training entirely!
When you first think about forex trading, it might seem complex given the number of currency pairs and related charts. Don’t worry; as a forex trader, you only need to understand two basic things:
- How prices move about each other
- How to take advantage of those movements
To trade profitably, you have to have the edge over other traders. One great place to start is by knowing something they don’t. For example, you could find a pair that has a poor correlation with the rest of the market – a situation where a change in one asset won’t affect another. If this happens, buying or selling that pair would be good – guaranteed profits minus the risk involved with trading on your instincts, which can often go wrong if not appropriately guided by knowledge and experience.
Trends in Forex Trading
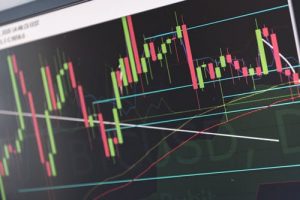
Trading charts are at the heart of forex trading systems. They allow you to see patterns that occur with regularity and can predict future movements in prices. There are many types of charts, but the focus here is on price action charts rather than trend line analysis or other factors which don’t directly involve price per se (e.g., fundamentals). These charts allow you to see recent activity within a drawing graph, allowing you to quickly determine if markets are trending, ranging, or inside a consolidation period. Price action is what traders focus on the most because it’s generally where profit opportunity comes from since trends will often continue for a significant length of time before reversing completely, thus allowing you to ride them for as long as possible.
Forex price action charts are very useful in determining current market sentiment and can be used to predict future prices – this is achieved by using specific patterns shown through data derived from historical trade activity. Some of these patterns work better than others. Still, once a trader has a few set strategies available to them, they become more confident when entering trades. They can apply specific rules to set themselves up with a suitable risk-reward ratio.
Essential forex price action techniques
Anchors
After a period of ranged market activity, setting a price to establish an anchor can be very useful in forecasting future action. For example, if the market ranges between 1.3201 and 1.3220 but then sets 1.3220 as its new anchor point at some stage, it’s more likely that the next move will see prices range between this value and the other end (1.3201).
Identifying Continuation Patterns
Once you know what different patterns look like, you can use them to predict future movement by looking for instances where these patterns appear consecutively or similar structures, thus indicating a continuation of existing trends/tendencies within a specific period.
Expanding Trends
As soon as price action starts moving beyond the range of a triangle pattern, it’s more likely to continue moving further in the direction of its initial move. Similarly, with flags & pennants, once these patterns have been broken through, they tend to continue their early momentum and maintain strong directional bias. If the price were moving down before reaching a flag, then an upside breakout would still indicate further downward movement).
Contracting Trends
Once again, this is the opposite of what we’ve already covered. After a flag or pennant has been formed, look for instances where prices quickly retract into that pattern before maintaining/breaking out from those confines. It tends to hold for any trend that has been broken and those that are still active. Still, the price will retrace usually broader than that of a flag/pennant.